Interactive
genotype &
phenotype
data

App gallery


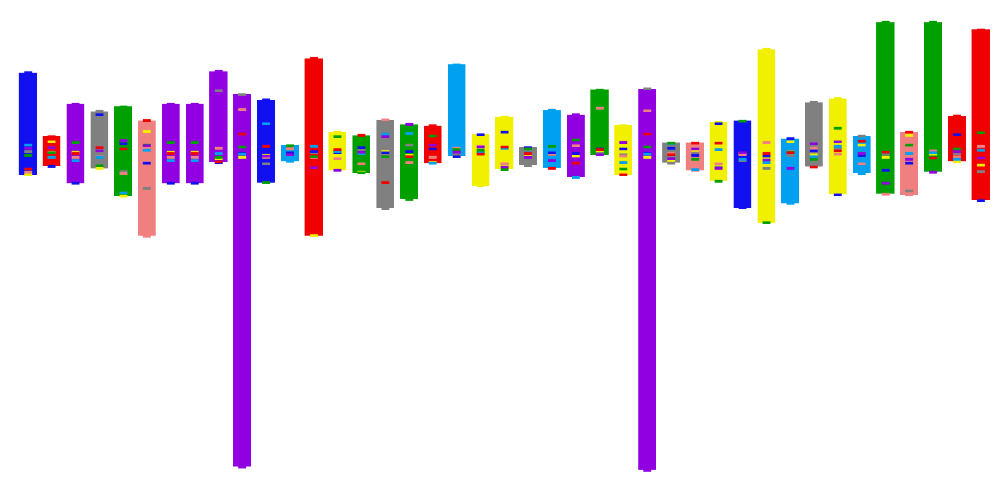
This app accompanies a paper all about the importance of development. We know that complex traits are structured by development, yet genomics seldom quantifies the importance of developmental pathways. That's what this app is all about.

Type some process you're interested in and you'll see what GO terms are listed under that process. From there, pick GO terms that you find interesting and we'll do the analysis right there and show you how alleles in our mouse sample covary with the shape of the face.

After you do all that, you can compare your pathway effect to any mutant in our database.
Process GP maps

Launch app

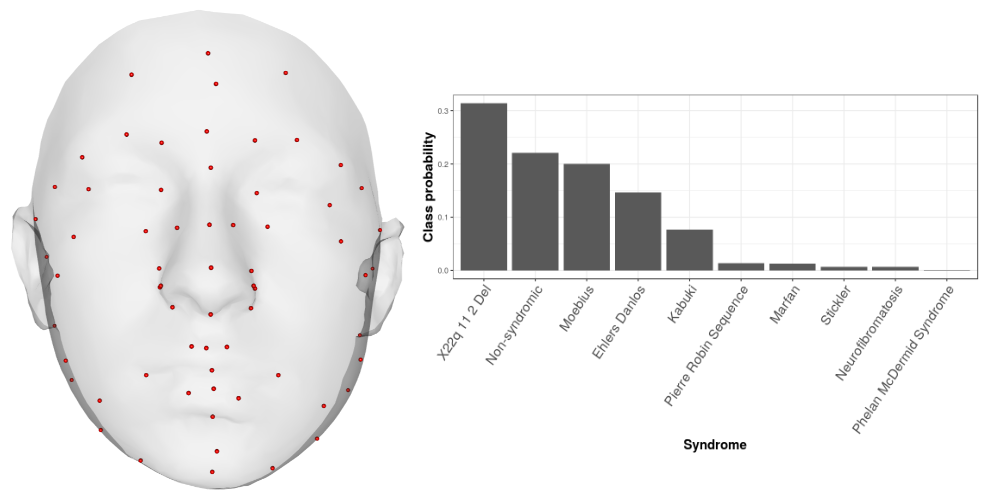
This is a demonstration of our syndrome classifier with a few example faces. The app currently takes an already measured face and feeds it through the classifier. The result is the relative confidence of syndrome scores.

You can compare the individual's face to the mean of any syndrome to get a sense for how morphologically similar they are to the syndromes the classifier suggests.

Syndrome classification

Launch app

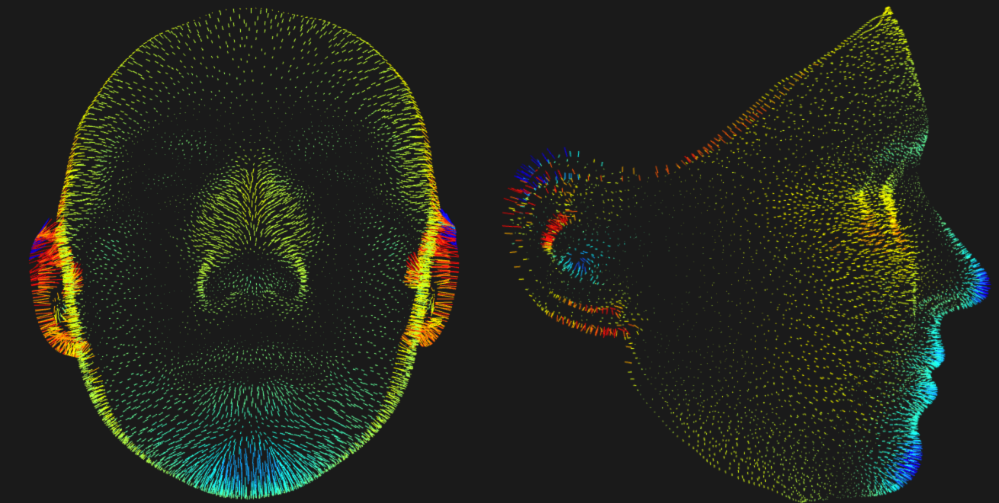
This app allows you to compare the morphology of a select subset of syndromes in our database. The differences are represented as heatmaps, with hot colors denoting larger areas and cold colors denoting smaller areas.

Additionally, you can compare the mean of the reference syndrome to the shape of 10 individuals of the target syndrome to get a sense for the heterogeneity in the target syndrome.

Syndrome Gestalts

Launch app

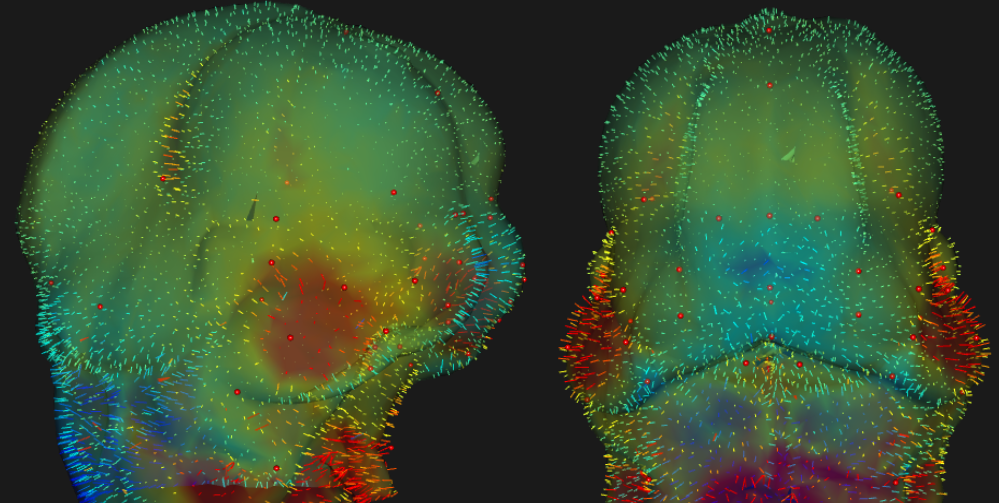
This is an applet to show how genotype and diet interact to effect facial morphology in early development. Here we exposed mice that are wildtype, null or heterozygous for the cilia protein B9d1 that have been exposed for three generations to a low (3ppm) or moderate (10ppm) folic acid levels in their diets.

Double click on a location on the plot to show how that region of the plot compares against the grand mean of the data (CVA score 0,0).

B9d1 mutant embryos

Launch app

Created by J. David Aponte